Cards
Each dashboard is made up of cards. Each card presents a data set or data point in one of several visualization modes, such as a chart, list, or table.
Cards can be configured to present almost anything, such as a list of users with critical events, a table that shows the event counts by users, or a KPI that shows the total number of users using Lacework Edge, just to name a few examples.
Viewing Cards
To see the cards that are available to you, go to Analytics > Dashboards and then click Card Library link at the top right.
Lacework Edge includes built-in cards that you can use to create your own dashboards. You can also create your own cards, which can then serve as the building blocks of your own custom dashboards.
For example, a card may present a KPI that shows the total number of users using Lacework Edge, as shown below:

As shown, the card has several elements:
- Underlying each card is a query to a dataset, and the name of the dataset is displayed in the top right. In this case,
EGACCESSKPISis the dataset. - The edit control icons beneath the dataset name let you edit, copy, or delete the card.
- Performance information shows performance data related to this query. Performance information is useful when you are troubleshooting new cards, and ensuring the performance of the query underlying the card for your users.
Create a Card
The quickest way to create a new card is to clone an existing card that closely match your desired card. You can then add filters to refine the information presented or modify the visualization, data source, data presentation, or other features of the card.
You can also create a new card by clicking the + Card button in the card catalog.
In the new card page, you can choose whether to create the card using the curated options or raw options. The curated card builder is a preview feature that is available to a limited set of customers only. It should be considered a beta feature and subject to changes.
The following instructions assume the use of the raw options.
To create a new card, follow these steps:
- In the new card page, enter a title for the card. If you do not type a title, a default is chosen for you based on the dataset you choose.
- Choose the type of card you want, from among Raw Data, Chart, KPI, or List. If you choose Chart, you can further specify whether to use a bar chart, pie chart, or table.
- Choose a dataset from the available options in the Dataset drop-down. After you select a dataset, you will be able to browse its data.
- Depending on the dataset you choose, select what data field you want to see.
- Choose any visualization options appropriate for your card.
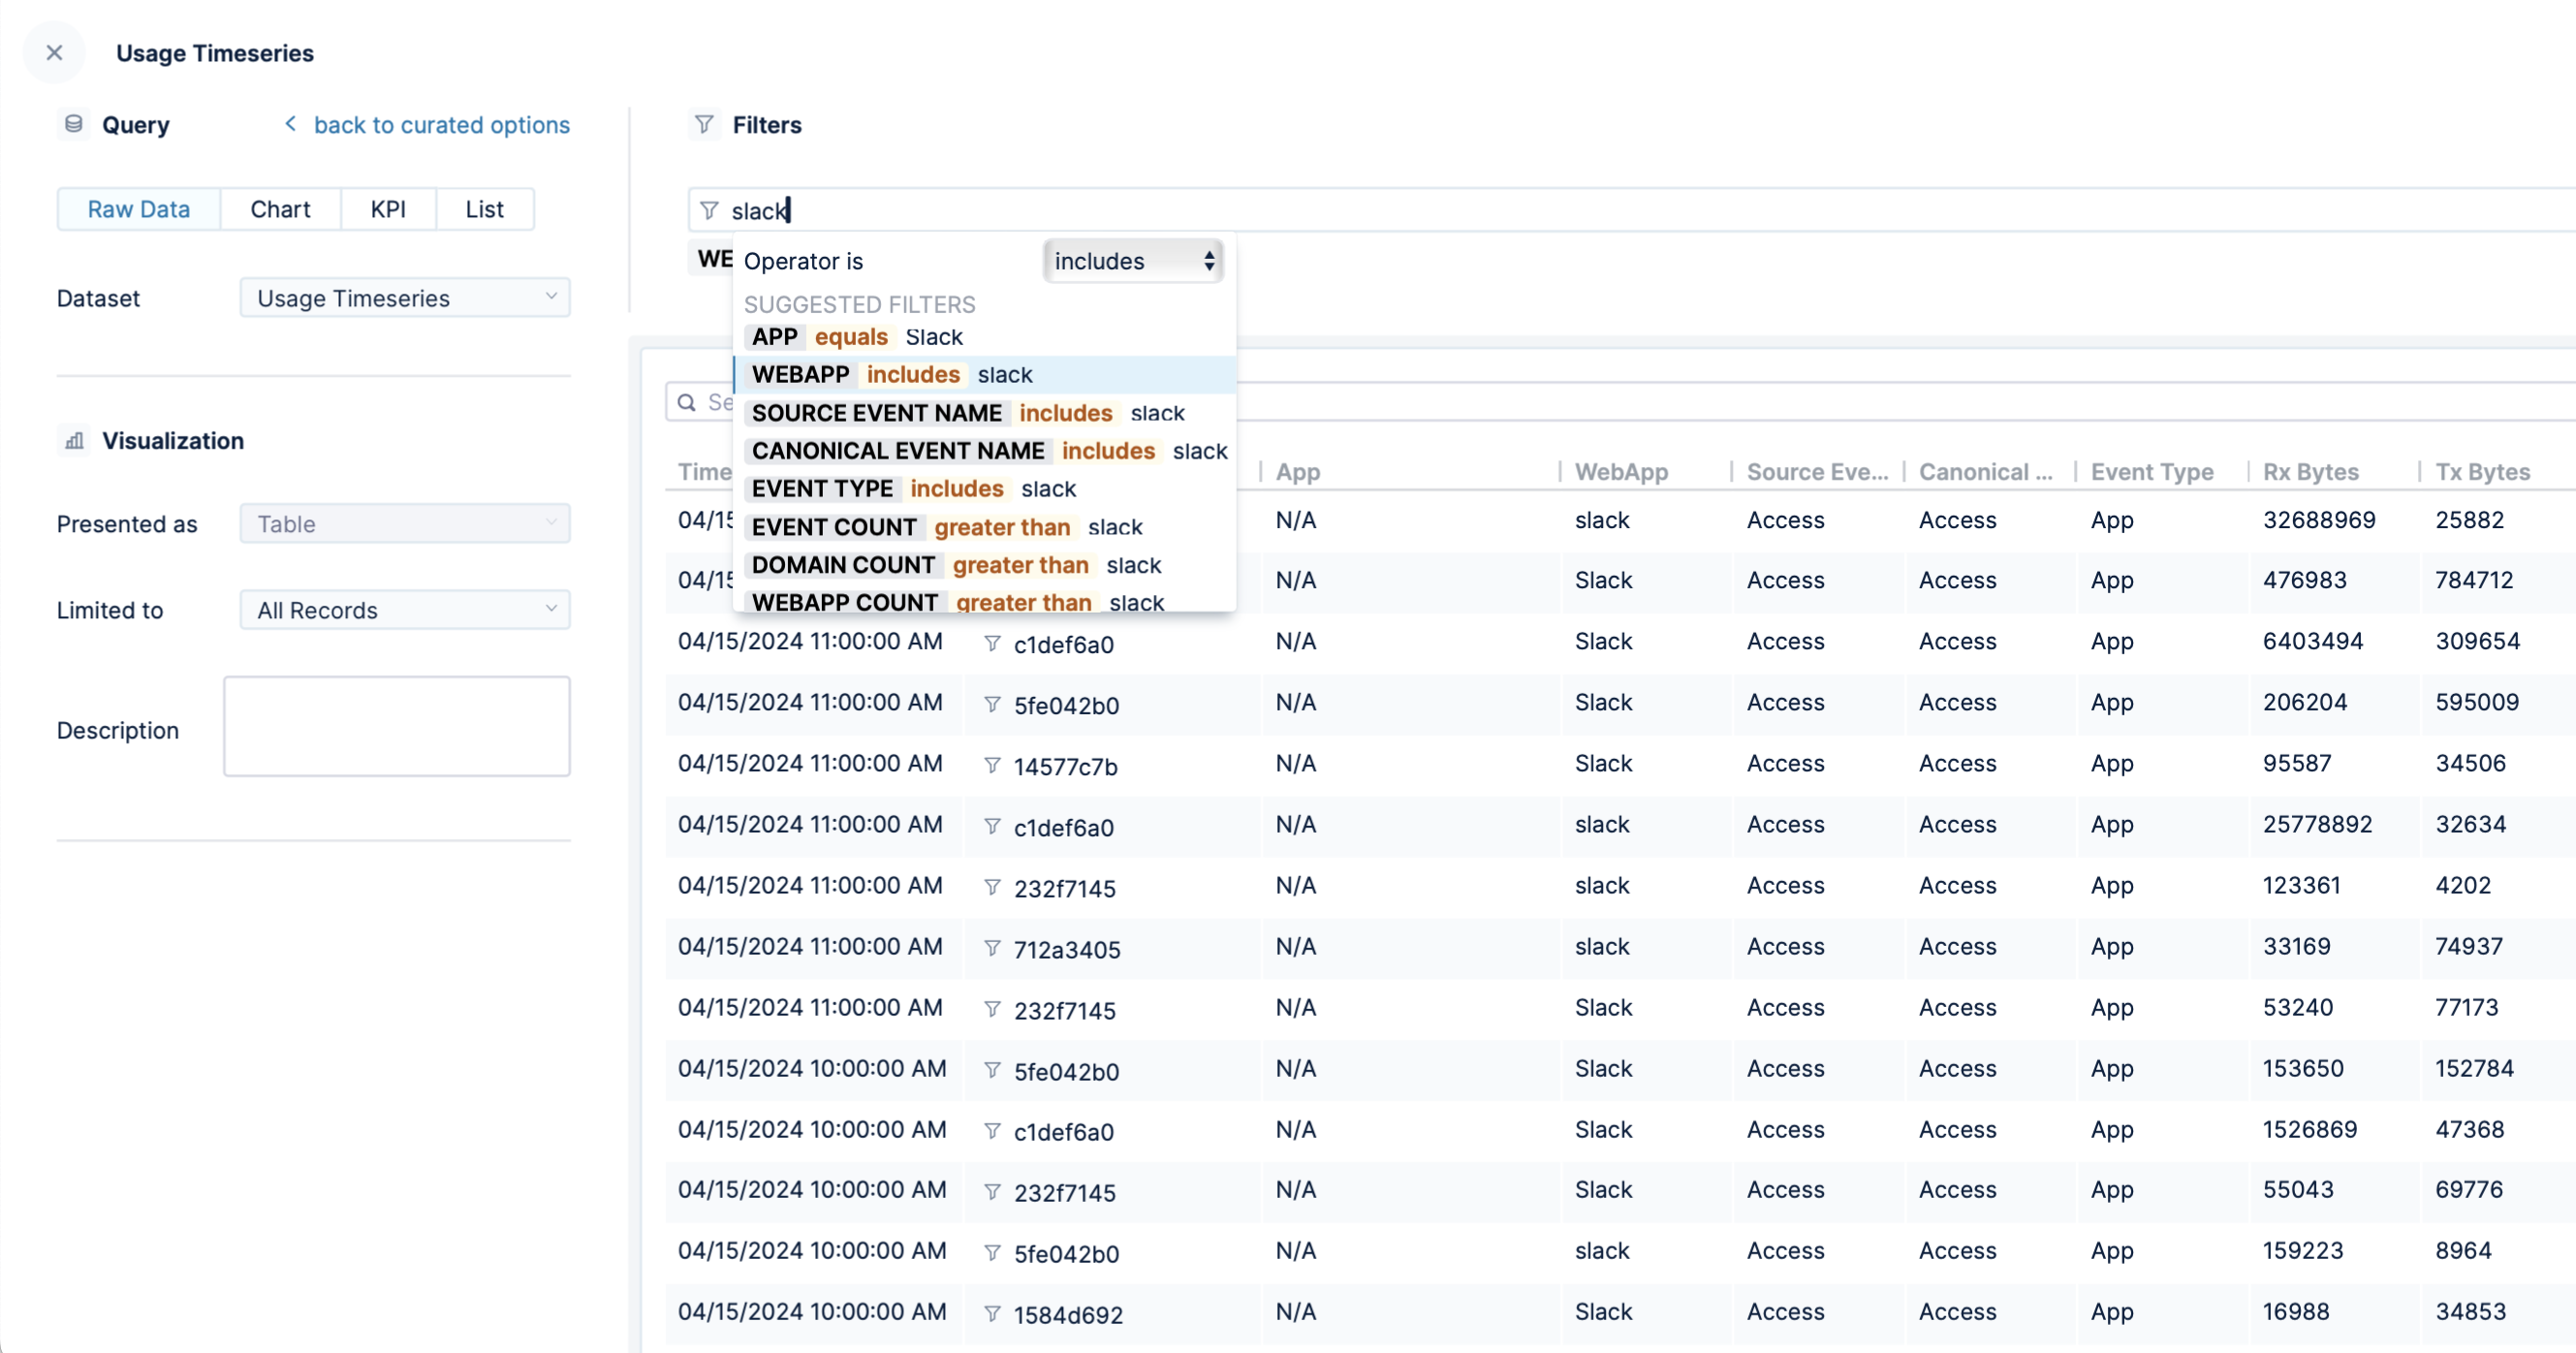
- If needed, use filters to refine the data returned for this card. To use the filter field, type the value against which you want to filter, and then choose the type of filter to apply to that value. For example, in the following card, the user application usage information is filtered to present Slack usage only.
- When finished click the Add Card button, which saves your card configuration. Your card will now appear in the card catalog and be available for dashboards.